

Unlocking the Power of Live Event Analytics: A Marketer’s Guide
Live events are a powerful tool for marketers, driving engagement and activity across the buying funnel. To make the most of these events, understanding how viewers interact with your content is crucial. This is where live event analytics come into play.
In this tutorial, we’ll explore the essential live event analytics every marketer should know and love using sample data. We’ll break down the key metrics to monitor, such as viewer engagement, quality of experience, technical performance, and demographic insights. By mastering these analytics, you can create better content, keep your audience hooked, and boost your marketing success.
Table of Contents
How Live Events Work for Marketers
Live events can be a valuable tool for all organizations, whether for product launches, educational webinars, interviews, or town hall meetings. They provide a unique opportunity to engage with your audience in real-time, creating a sense of immediacy and connection that pre-recorded content simply can’t match. This real-time interaction can drive deeper engagement and foster stronger relationships with your audience.
Understanding analytics is crucial for marketers leveraging live events. By analyzing viewer behavior, you can gain actionable insights into what’s working and what isn’t. This allows you to refine your approach, improve content delivery, and maximize the impact of your live events. In the following sections, we’ll explore the key live event analytics you should monitor to ensure your live events are as effective and engaging as possible. Using our example of a high school graduation event, we’ll illustrate how these metrics can provide valuable insights and drive better marketing outcomes.
Key Engagement Metrics to Monitor
To maximize the effectiveness of your live events, it’s essential to monitor key engagement metrics. These metrics provide insight into how your audience interacts with your content, helping you understand what resonates and what needs improvement.
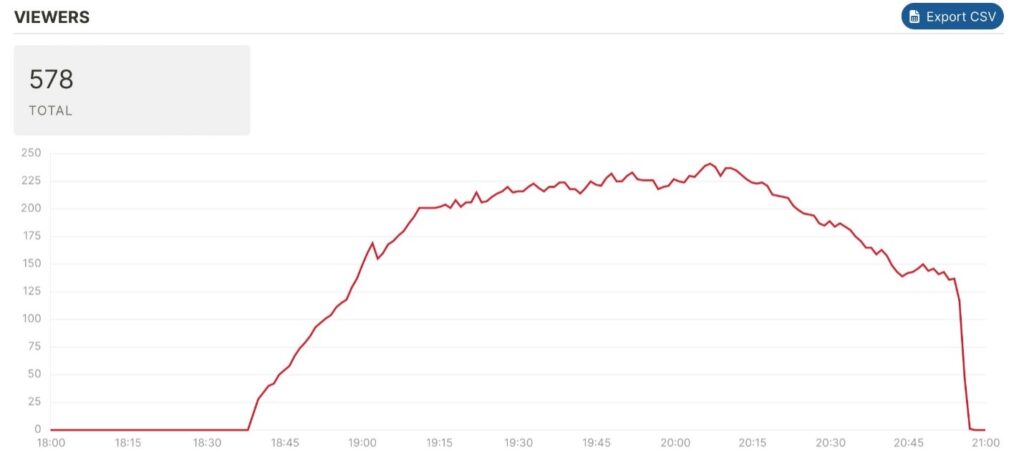
Figure 1. Live viewers during the event. Note the lack of drop-off until the event ended, indicating general satisfaction with the content.
Here are the primary engagement metrics you should focus on:
Viewer Count and Attendance
The first metric to monitor is the number of viewers who attended your live event. This helps you gauge the overall reach and initial interest in your content. Knowing your viewer count also helps you set benchmarks and measure the success of your promotional efforts.
Engagement Duration
Engagement duration measures how long viewers stay tuned into your live event, which indicates how compelling and relevant your content is to the audience. In our example, the length of engagement was very good, with most viewers staying until the end. This suggests that the content is holding the audience’s attention, while shorter durations may signal the need for more engaging or better-structured content.
Drop-off Points
Understanding where viewers drop off during your event can provide valuable insights into which parts of your content might be losing their interest. By analyzing drop-off points, you can identify sections that need improvement or find ways to keep the audience engaged throughout the event. In our example video, there were no significant drop-off points until the end, indicating general satisfaction with the content.
Page Displays vs. Video Plays
Monitoring the number of page displays versus video plays is essential to understand the initial interest in your content and how many of those visits convert into actual viewers.
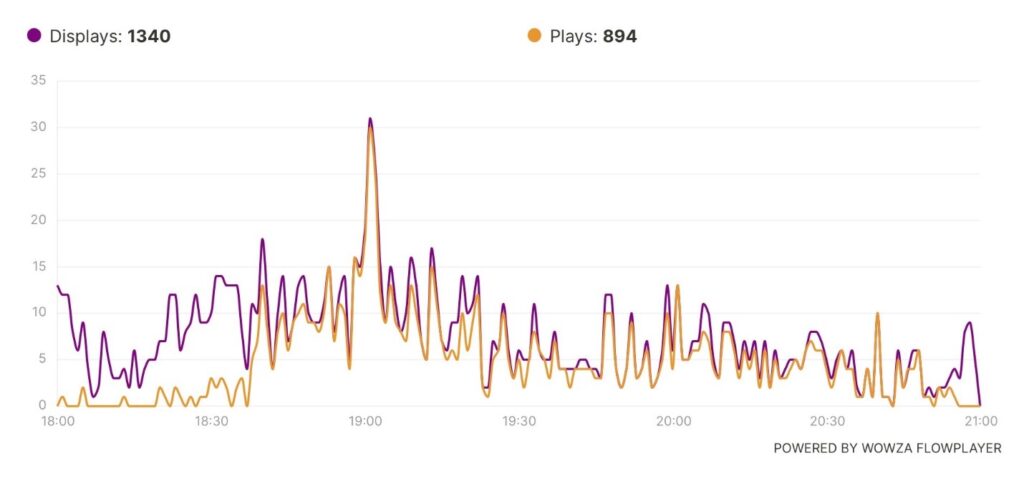
Figure 2. Page displays vs plays. After some initial duds, most page displays results in plays.
Page Displays
Page displays indicate how many times the event page was loaded. In our example, there were 1,340 page displays. This number is a reflection of your marketing efforts, showing everyone you enticed to actually visit the event.
Video Plays
Video plays reflect how many of those page displays resulted in the video being played. In our example, there were 894 video plays. This conversion from page displays to video plays indicates that a significant portion of the audience was interested enough to start watching the event.
Analysis of the Data
The data reveals more page loads at the beginning, which could indicate initial testing or curiosity. Over time, the number of video plays evened out, suggesting stable and consistent engagement from the viewers.
Quality of Experience (QoE) Metrics
Ensuring a high-quality viewing experience is crucial for keeping your audience engaged and satisfied. Quality of Experience (QoE) metrics help you understand the technical performance of your live stream and identify any issues that might affect viewer satisfaction. Here are the key QoE metrics to monitor:
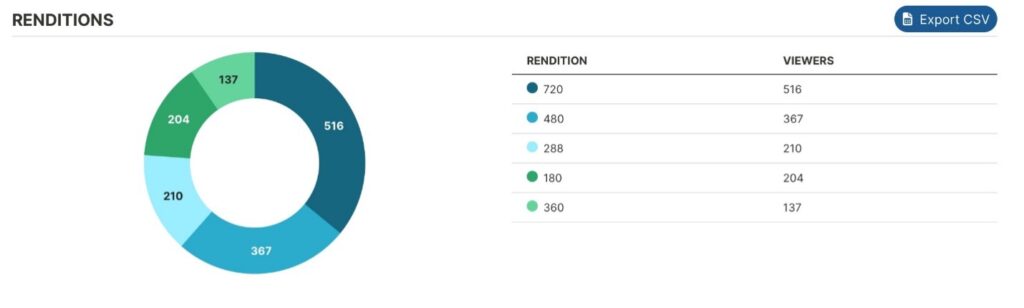
Figure 3. Quality levels watched during the live stream.
Video Resolution and Quality Levels
One of the primary QoE metrics to track is the video resolution and quality levels experienced by your viewers. Higher resolution generally indicates a better viewing experience, which can lead to higher audience satisfaction and engagement. In our example video, a significant portion of viewers enjoyed high-quality streams, indicating that most of the audience experienced top-tier quality, a positive sign of stream performance.
Distribution of Quality Levels
Understanding the distribution of quality levels among your viewers helps you assess the overall viewing experience. In our example, viewers were spread across different quality levels: 210 viewers at 288p, 204 viewers at 180p, and 137 viewers at 360p. This distribution shows that while most viewers had a high-quality experience, some were on lower-quality streams, possibly due to bandwidth limitations, possibly because they were watching on mobile phones.
Device Usage
Understanding which devices your audience uses to view your live event is crucial for tailoring your content and optimizing the viewing experience. Different devices have varying screen sizes, resolutions, and connectivity capabilities, all of which can impact how your content is consumed.
Here are the key device usage insights to monitor:
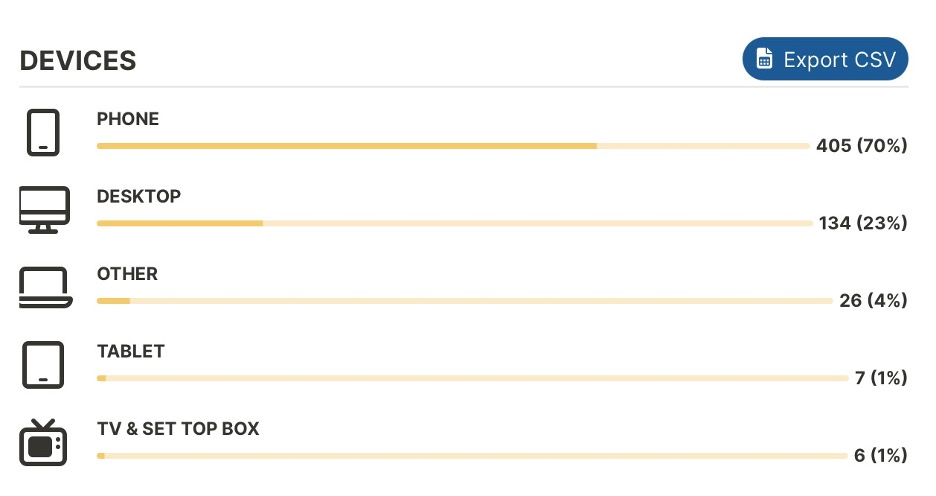
Figure 4. Devices used to view the event. Predominant mobile phone usage probably resulted in many viewers watching quality lower than 720p.
In our example video, a significant portion of the audience watched the event on their phones, with 70% (405 viewers) using mobile devices. This insight highlights the importance of making your content mobile-friendly. When many viewers are using smaller screens, it’s essential to avoid dense slides with too much text or complex graphics, as they can be hard to read. Instead, aim for simplified slides and clear visuals that are easy to understand on a phone screen.
Additionally, ensuring that your event platform and any associated materials are optimized for mobile devices is crucial. This means using a responsive design that adjusts well to different screen sizes, providing a seamless experience for mobile viewers. You also might consider customizing your encoding ladder for mobile playback.
Even if mobile viewers dominate, it’s also important to consider other devices. In our example, 23% (134 viewers) watched on desktops. For the small percentage of viewers using tablets, TVs, or other devices, it’s essential to ensure that your content scales well across different screen sizes and resolutions.
Geographic and Demographic Insights
Geographic and demographic data provide valuable insights into where your viewers are located, which can help tailor your content and marketing strategies. Understanding the geographic distribution of your audience allows you to create more relevant and targeted content, enhancing engagement and satisfaction.
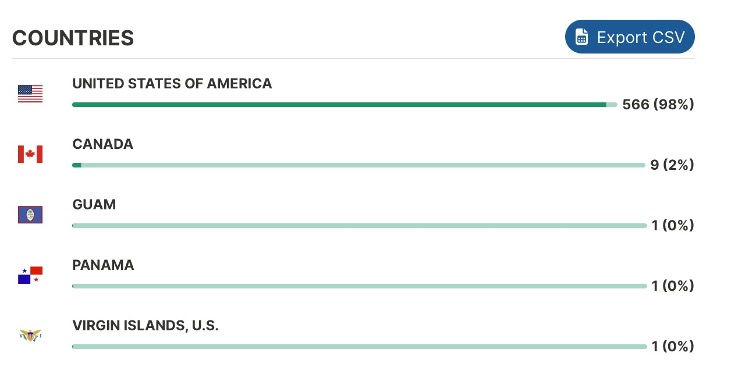
Figure 5. This data is crucial for multi-national organizations, not so much for a high school graduation.
In our example video, the vast majority of viewers were from the United States. Additionally, a small number of viewers were from Canada (9 viewers) and even fewer from places like Guam, Panama, and the Virgin Islands (1 viewer each). While these numbers are minimal, they highlight the potential for broader reach. Even if the primary audience is domestic, it’s beneficial to acknowledge and cater to international viewers, ensuring that your content is accessible and engaging for them as well.
Tailoring content based on geographic data can include time zone considerations for live events, localizing language, and cultural references, and understanding regional interests and preferences. For example, if you know a significant portion of your audience is in a particular region, you can schedule your events at times convenient for them, mention relevant local events or issues, and even consider translation or subtitle options for non-native speakers.
Live event analytics are essential for marketers to understand and improve audience engagement. By examining key metrics such as viewer count, engagement duration, and device usage, marketers can gain insights into the effectiveness of their live events. For example, data from a high school graduation event shows stable engagement and significant mobile viewership, highlighting the need for mobile-friendly content and the potential for international reach.
Analytics for Video Engineers!
Check out our video engineers guide on analytics to check before (and during) an event.
Summary
Live events can be highly valuable for driving real-time interaction, fostering deeper connections, and accelerating the sales cycle. By examining key metrics such as viewer count, engagement duration, and device usage, marketers can gain insights into the effectiveness of their live events, and refine their strategies to create more engaging and impactful live events.
Explore Wowza’s live event analytics capabilities for yourself with our free to start, pay as you go plan or talk to one of our streaming experts.