

6 Facebook Live Metrics to Track Video Performance & Reach
So you’ve realized the importance of streaming to Facebook Live, and made it part of your marketing strategy. You’ve invested in professional equipment and created content you think will resonate with your audience. But how do you know if your efforts are paying off?
To understand how your Facebook Live videos are performing, you’ll need to analyze some key metrics. Luckily, Facebook has a built-in analytics platform, Page Insights, that lets you track a wide variety of statistics on your videos, posts, campaigns and audiences.
Wowza recently published an Ultimate Guide to Facebook Live streaming, where we cover how to use analytics to track the performance of your live streams. In this post, we’ll share some insights from the guide—specifically, where to find key metrics and how to interpret the most important Facebook Live analytics, including:
Post Performance
From the Posts tab in Page Insights, scroll down to “All Posts Published.” Video posts will have a video-camera icon. Click on these to deep-dive into the performance of either the post or of the video itself. You can also see how your overall Facebook video statistics stack up against those of other content types.
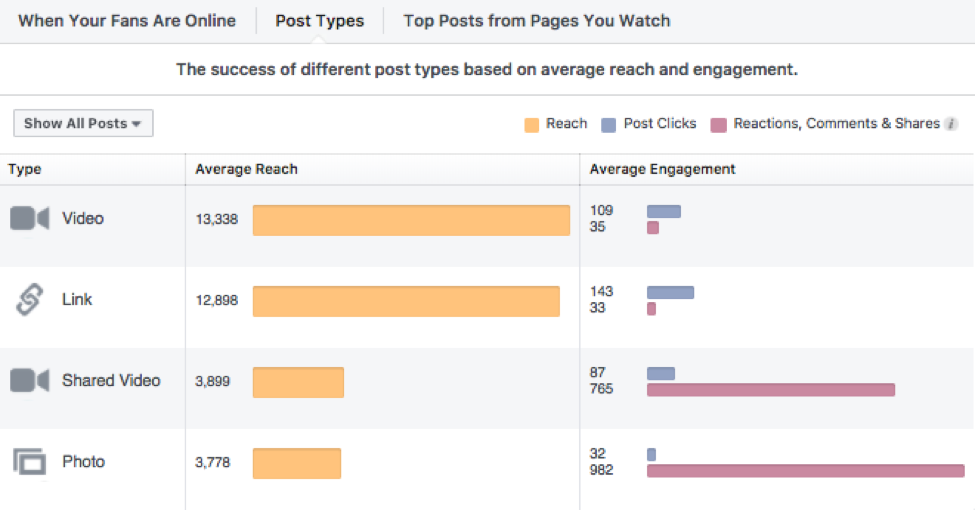
Post Types metrics
Facebook video post performance metrics at a glance
Facebook Video Engagement Stats
This is the most crucial measure of how viewers are responding to your live streams. The Facebook Video engagement rate metric shows the percentage of viewers who took some sort of action with your video, such as sharing, clicking or commenting. With an at-a-glance view of your top-performing videos, you can easily replicate what’s working.
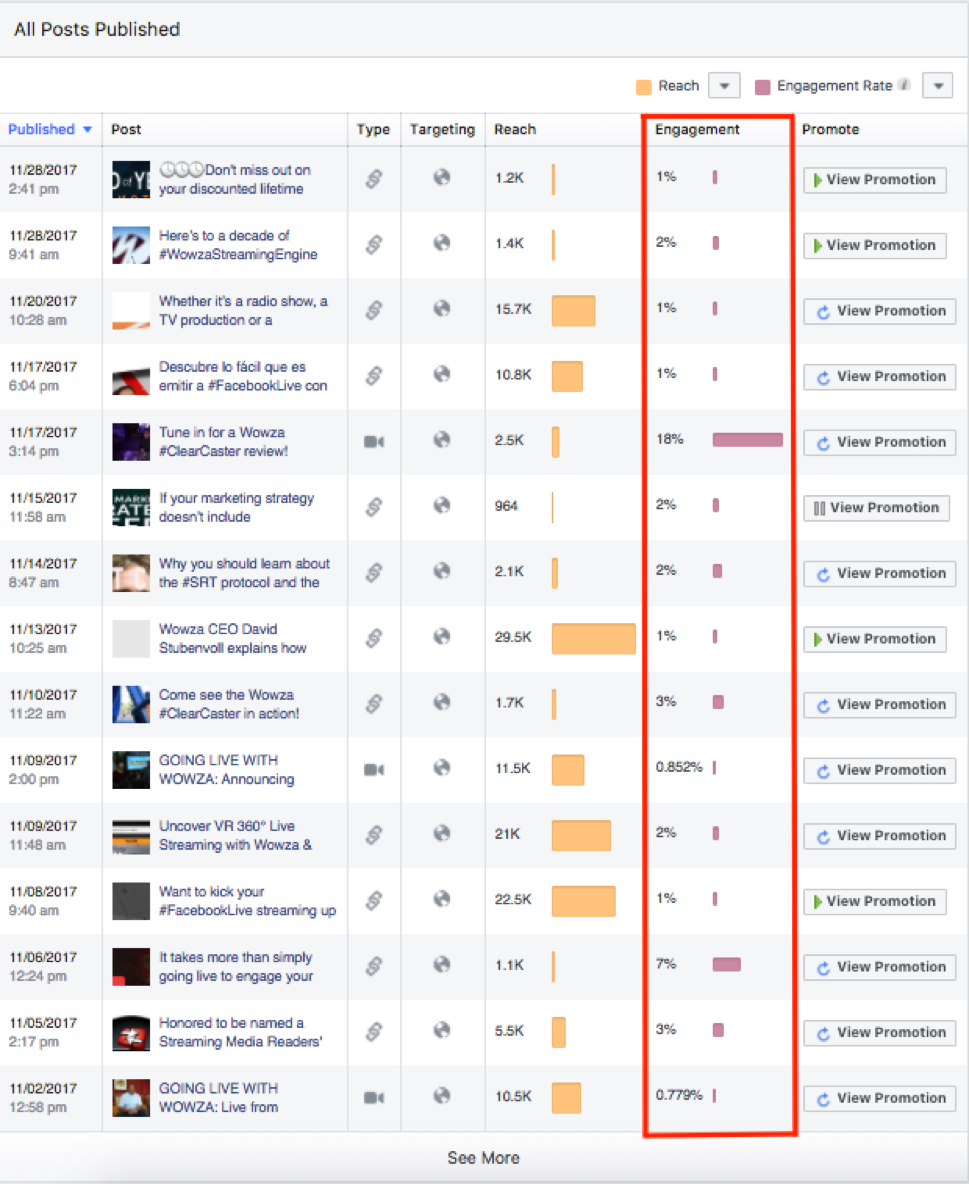
Facebook Live engagement rate metrics
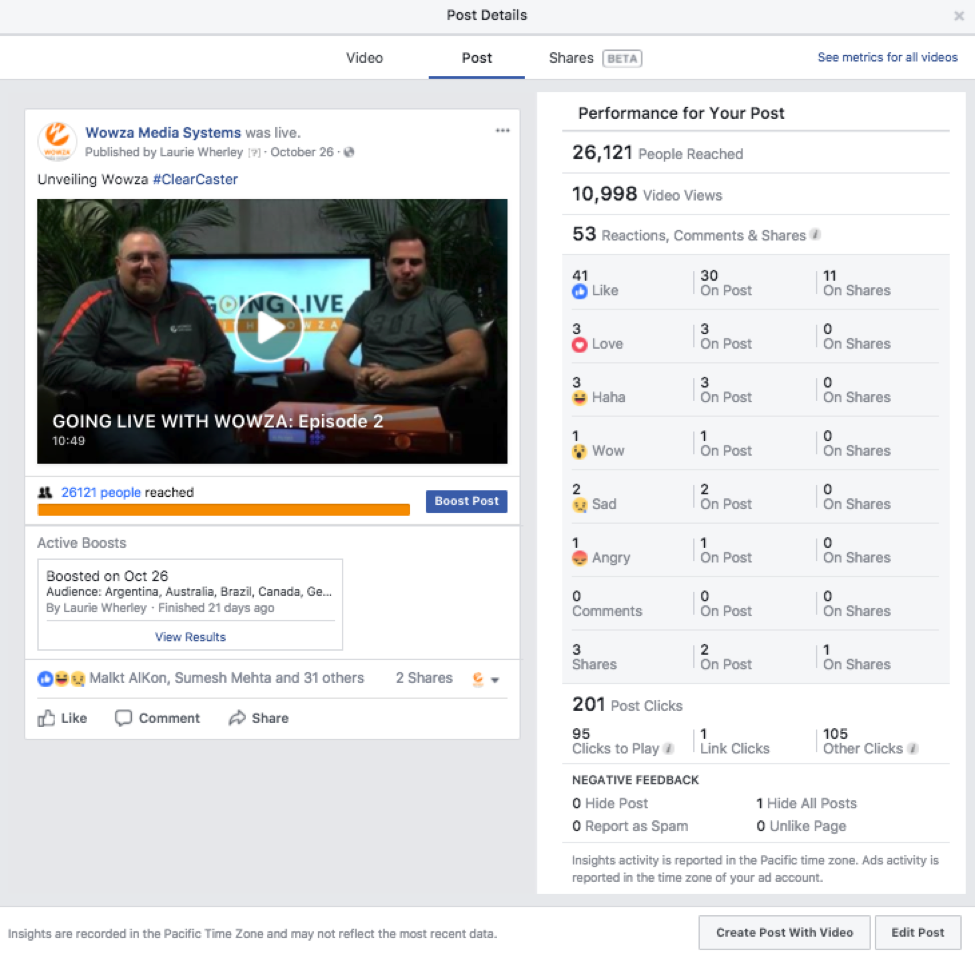
You can also drill down into specific engagement metrics to track the number of reactions, comments and shares for each video. This shows you which content motivates viewers to act. A new feature, Highlighted Shares, reflects the top five Pages that have re-shared your videos (in terms of the number of views), along with average watch time and engagement metrics for the shares.
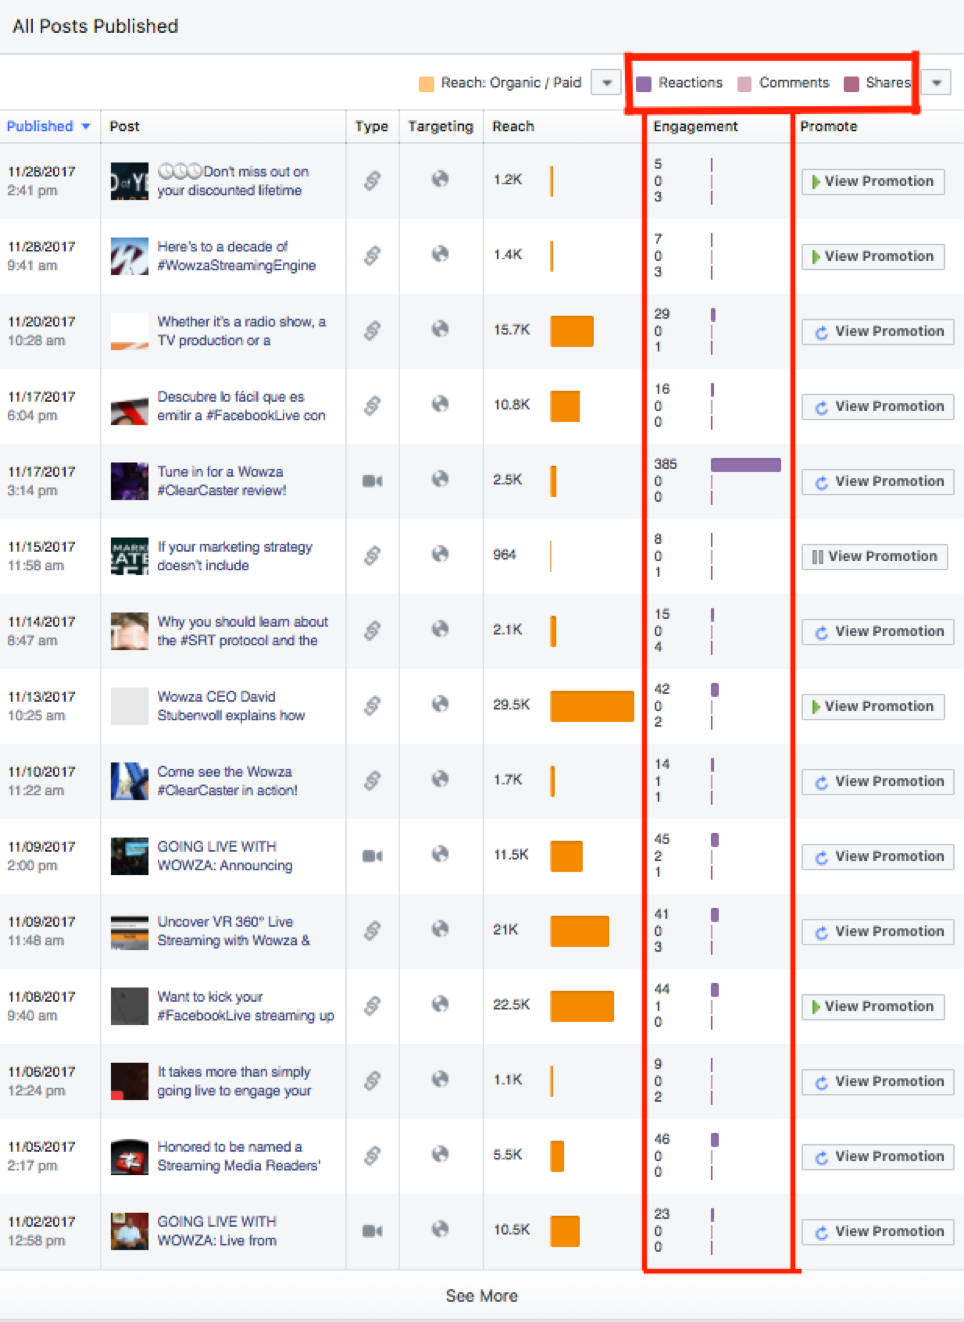
Metrics on reactions, comments and shares for Live videos
Viewer Retention Metrics
Track viewer retention metrics for individual videos by going to the Post Details tab and selecting “Video.” These metrics include the number of video views, and the number of peak live viewers (the largest number of people watching simultaneously at any given point).
What counts as a “view” on Facebook? Anytime your video is played for three seconds or more, it’s considered a view.
How do you track you Facebook video completion rate? Within Post Details, you can see whether people are watching your entire video by tracking average watch time and 10-second views: the number of times your video was watched for at least 10 seconds, or nearly its total length (whichever comes first).
If significant numbers of viewers are dropping off at approximately the same points in a given video, they may not find the content consistently engaging. Make sure you involve your audience directly, and keep your broadcast moving at a steady pace.
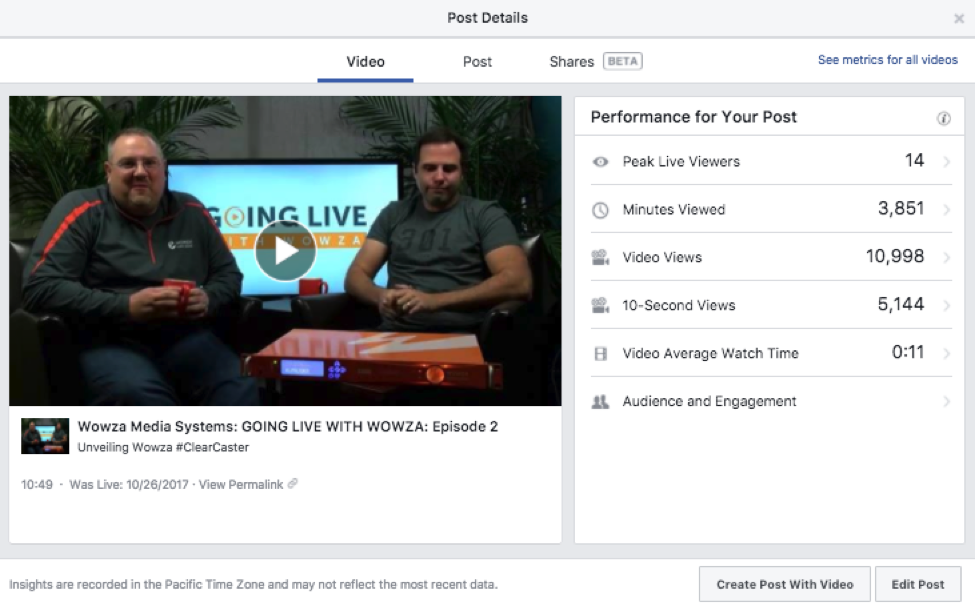
Facebook viewer retention metrics by post
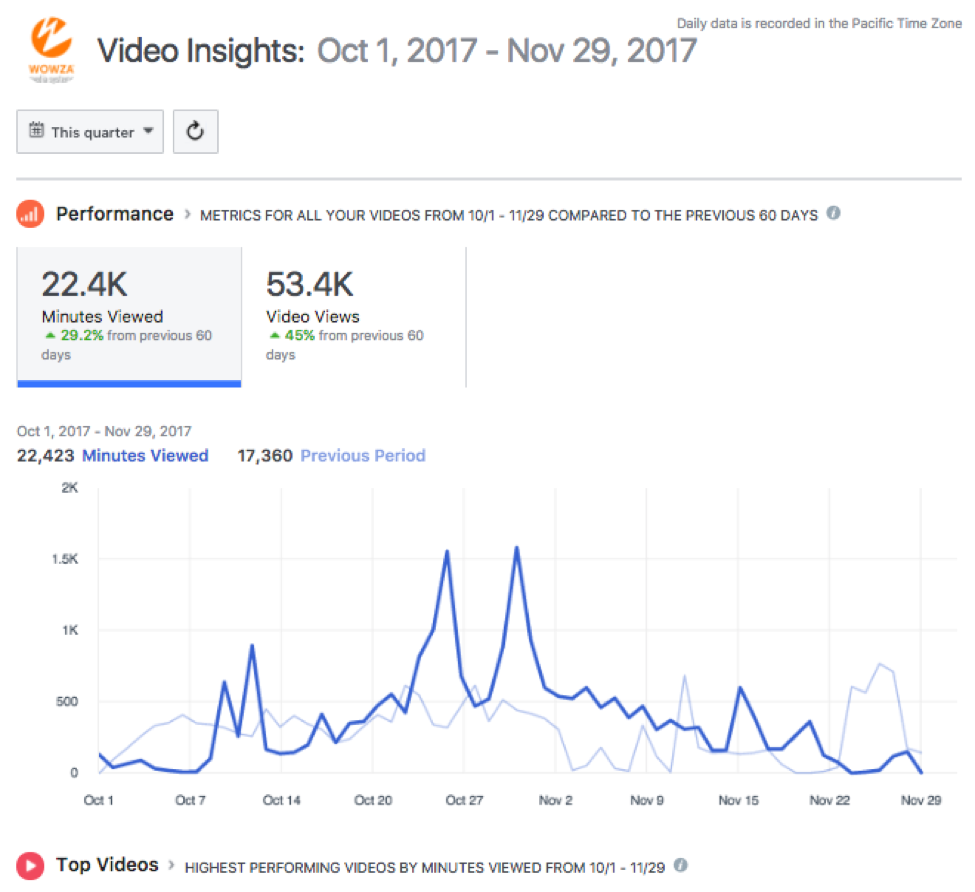
Video Insights, which shows data on viewer retention
Clicks
Clicks offer a window into what’s driving traffic. The number of times someone clicked to play your video is especially important, since this reflects how many viewers voluntarily elected to watch the live stream, versus it just playing automatically in their News Feed. Other important metrics include clicks on links or calls to action in your video post; on your page title; or on “See More” links.
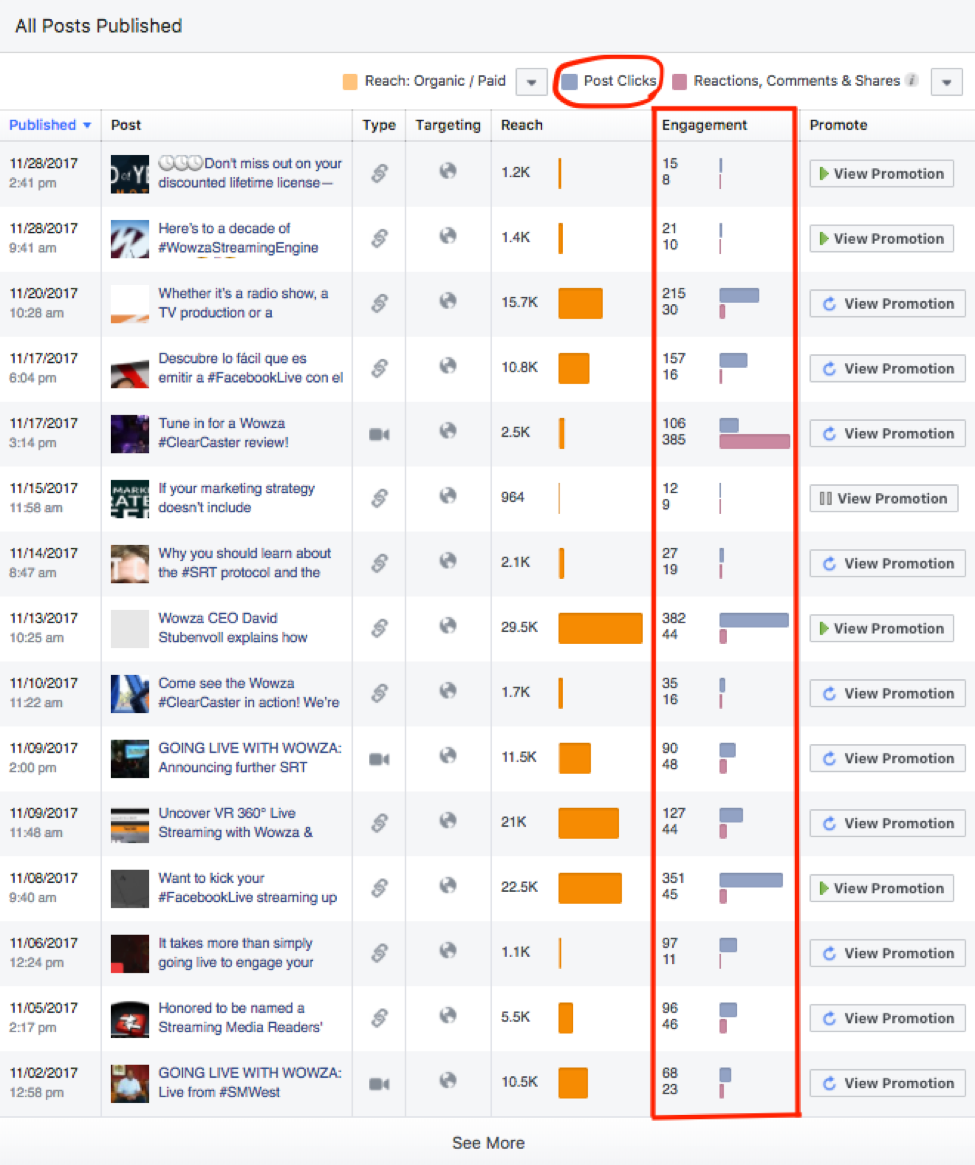
Post clicks metrics
Organic and Paid Reach
How many people have seen your video and promotional posts, both through organic search traffic and paid promotions? Compare these channels side-by-side to see fluctuations over time and track where you should be spending ad dollars.
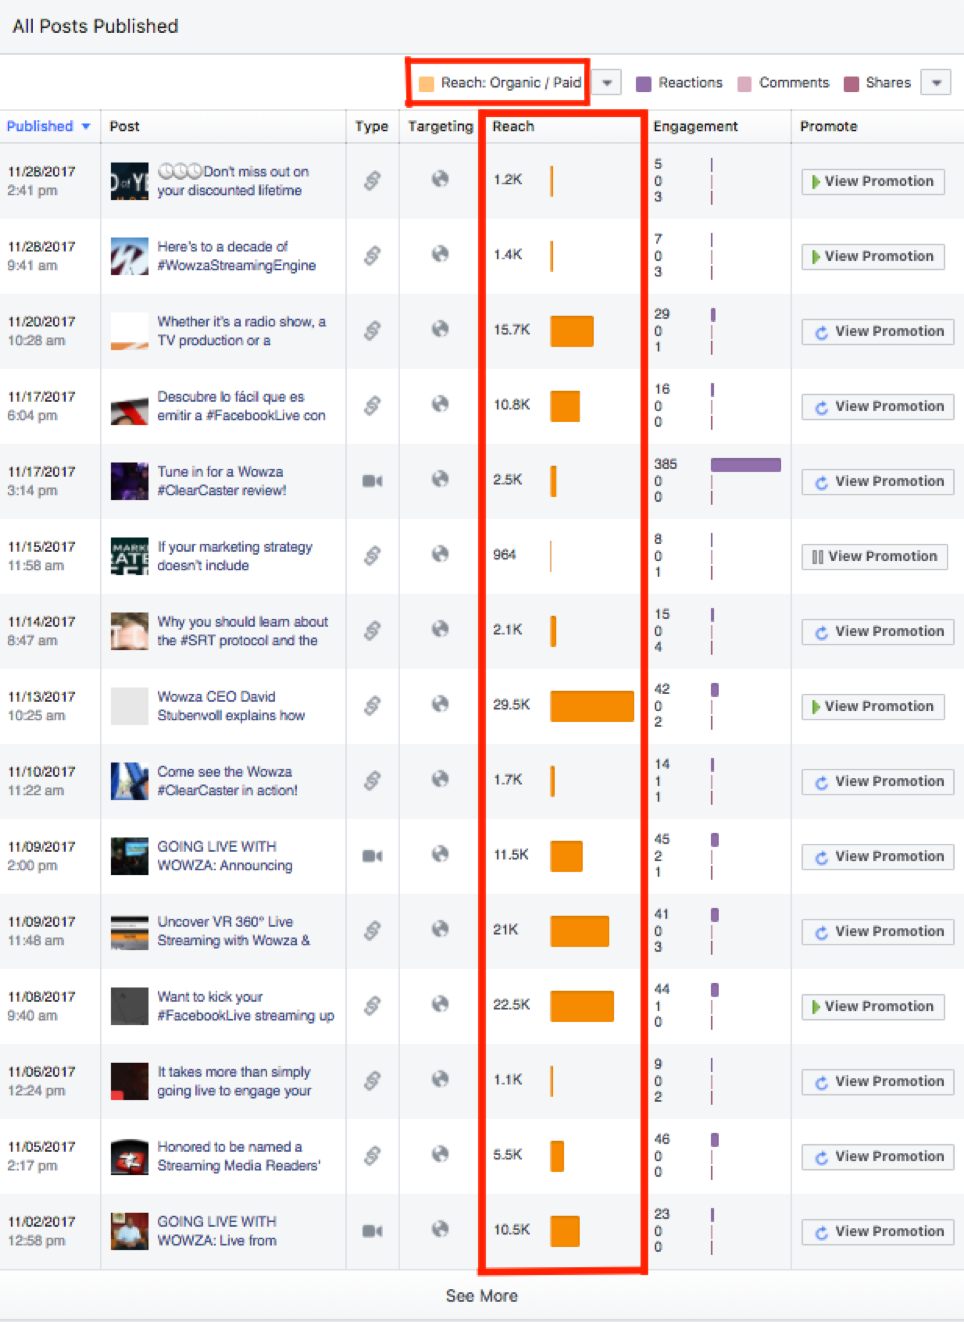
Organic and paid reach metrics
What is a good organic reach on Facebook? Organic reach can vary widely by industry, content and intended audience. The “organic reach” metric within Page Insights is an average based on the number of followers you have. This average can range, based on your industry, from just above 7 percent for retail and consumer Pages to nearly 30 percent for travel and leisure Pages.
How do I increase my reach on Facebook? As Facebook Live has increased in popularity, many users have seen a decline in organic reach; this is largely because there is so much content being published, it’s harder for searchers to stumble across individual posts. For this reason, Facebook recommends using paid advertising, including stand-alone ads and boosted posts, to get your content in front of the right people, rather than relying on organic traffic alone.
What’s more, the Facebook algorithm also tries to show users the content that’s most relevant to them specifically. The more targeted your live streams are to your desired audience, the more likely they’ll show up in their News Feeds.
If you need more help creating content that resonates with your followers and grows your organic reach, check out our best practices for Facebook Live, or download The Wowza Ultimate Guide to Facebook Live Streaming: a comprehensive resource that tells you everything you need to know about creating professional broadcasts on this platform.
Negative Feedback
Of course, it’s also important to track what’s not working. Negative Feedback allows you to monitor the number of hides for individual and overall posts; the number of spam reports; and the number of page unlikes. If any of your videos are turning viewers away, consider a course-correction.
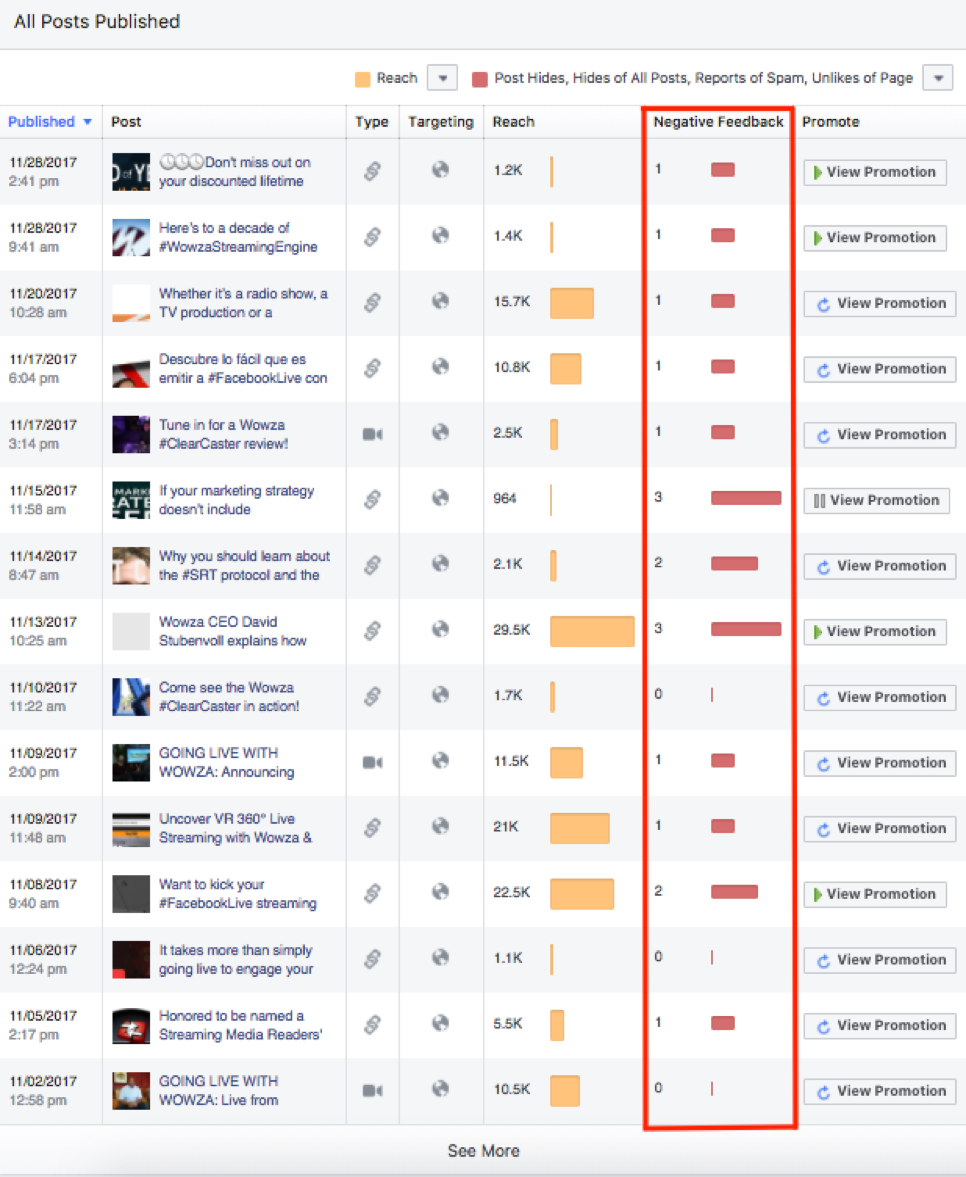
Tracking Negative Feedback
Tracking your Facebook Live metrics can help you create more of the content that engages and resonates with your audience, so you can do more of what’s working and build a loyal following.
Facebook Live Benchmarks and Statistics
Many content creators are curious to know how their video performance stacks up against the competition. This can vary widely depending on your industry and the type of content you’re creating, so average statistics for Facebook video performance are hard to come by. However, to give you an idea, we’ve gathered these benchmarks from around the web:
Facebook Video Reach vs. Views
- Average reach for a native Facebook video: 16.7% of the total audience
- Total number of video views (Q1 2017): 700 million
Facebook Video Views Statistics
- Average number of videos published per page (Q1 2017): 24
- Average percentage of views from paid Facebook advertising: 14%
- Percentage of pages that paid for at least one video view, Q1 2017: 67%
Facebook Video Average Watch Time
- Average watch time for VOD: 2.6 minutes
- Average watch time for Facebook Live video: 34.5 minutes
- Percentage of views that were 30-second views, Q1 2017: 29%
View Through Rate on Facebook
- Average watch time for all videos (Q1 2017): 4% of full video length
Facebook Video Benchmarks
- Average engagement rate for non-live videos: 2.2%
- Percentage of total video viewing that comes from shares vs. the original post: 40%
- Promotion rate for non-live videos: 72%
Facebook Live Benchmarks
- Average engagement rate for live videos: 4.3%
- Percentage of Live broadcasts that happen within Facebook Groups: 4%
- Promotion rate for Live videos: 78%
(Sources: Facebook Live: What You Should Know; The State of Facebook Video in the Year 2017)
Want to learn more about how to broadcast effectively on Facebook Live? Download our Ultimate Guide.
Additional Resources:
The Facebook Live Streaming Benchmark Report 2017
Facebook Page Barometer (Agora Pulse)
Webinar: Ensure Success on Facebook Live With Wowza ClearCaster